GradientFI·2025
Merchant Statement Email Redesign for Faster Financial Analysis
Turning a static monthly report into a tool cross-border merchants use to make decisions
- Role
- Product Designer
- Timeline
- [YEAR] · 1 week
- Team
- Solo designer, with the manager and a developer
- Impact
- 92% of merchants preferred the redesign
Overview
Context and My role
GradientFi is an embedded finance company that provides cross-border payment infrastructure. Merchants on its platform receive a monthly processing statement summarizing their activity.
I was the sole product designer on the project and led the redesign end to end. That covered defining the information hierarchy, exploring multiple layout directions, improving readability across dense datasets, and refining through iterative feedback. I worked closely with the manager and the developer throughout, both to understand the business goals behind the ask and to keep the design buildable within the email constraints and the one week timeline.
Problem
Turning a vague brief into a clear problem
The brief I received from the PM was broad. The ask was simply to redesign the merchant statement experience, with no stated direction on what was failing or what success would look like.
I set up 1:1 meetings with the CEO and the manager to establish three things: why the redesign was being funded now, what specifically was not working in the current experience, and what a good outcome looked like from both the business side and the merchant side.
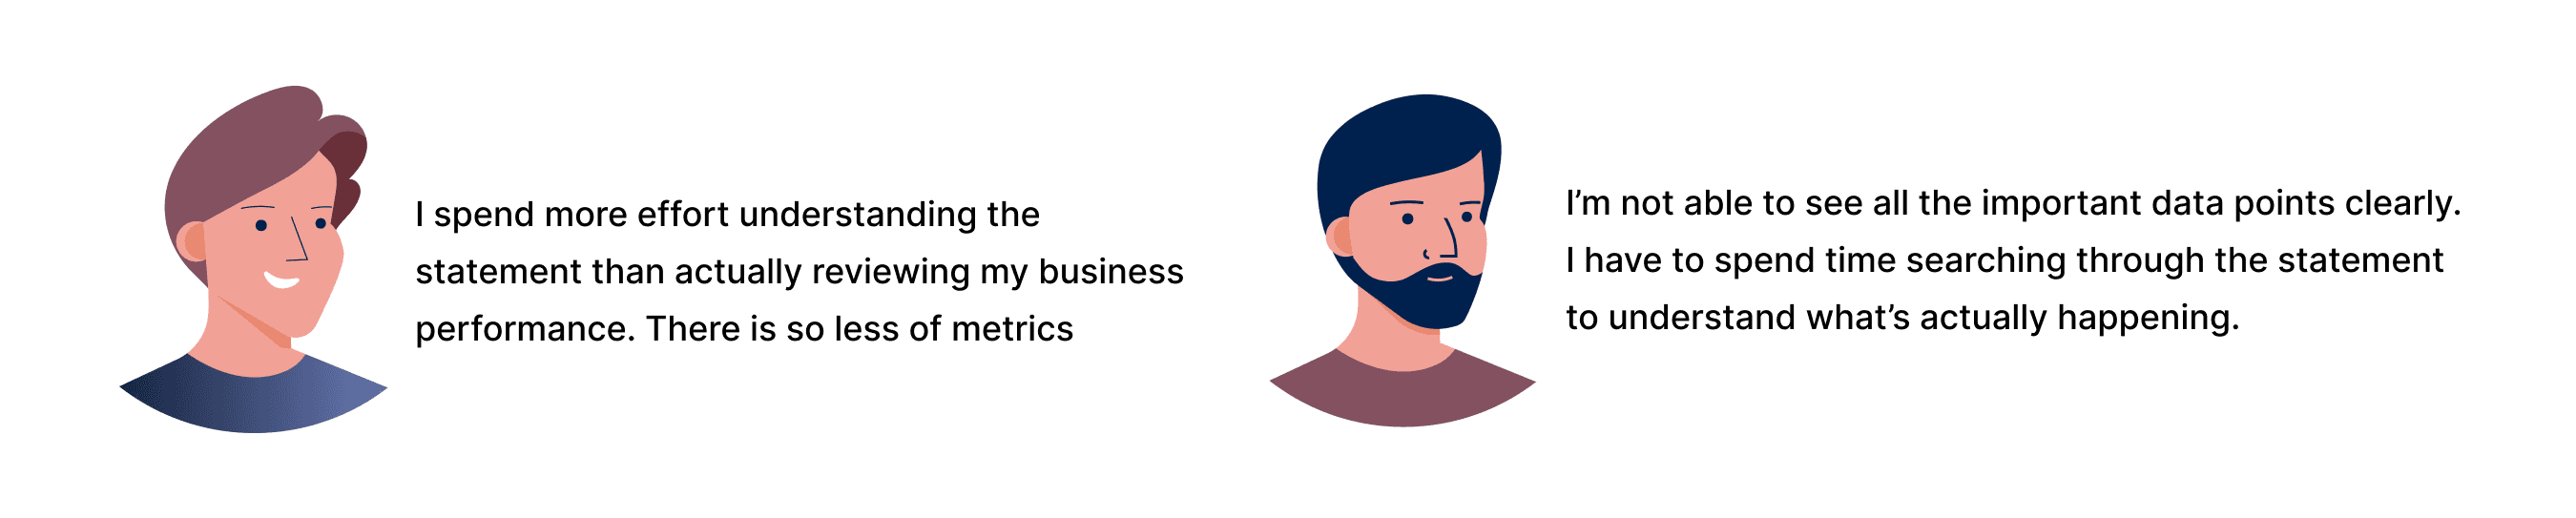
I then reframed the ask using an extended Jobs to Be Done statement, which turned a vague redesign request into a testable problem.
JTBD Framework
When merchants receive their monthly processing statement, they want to quickly understand their business performance, transaction flow, fees, and settlement details, so they can reconcile accounts faster, identify issues early, and make confident business decisions without manually analyzing dense financial data.
Solution
From raw data to a statement merchants can act on
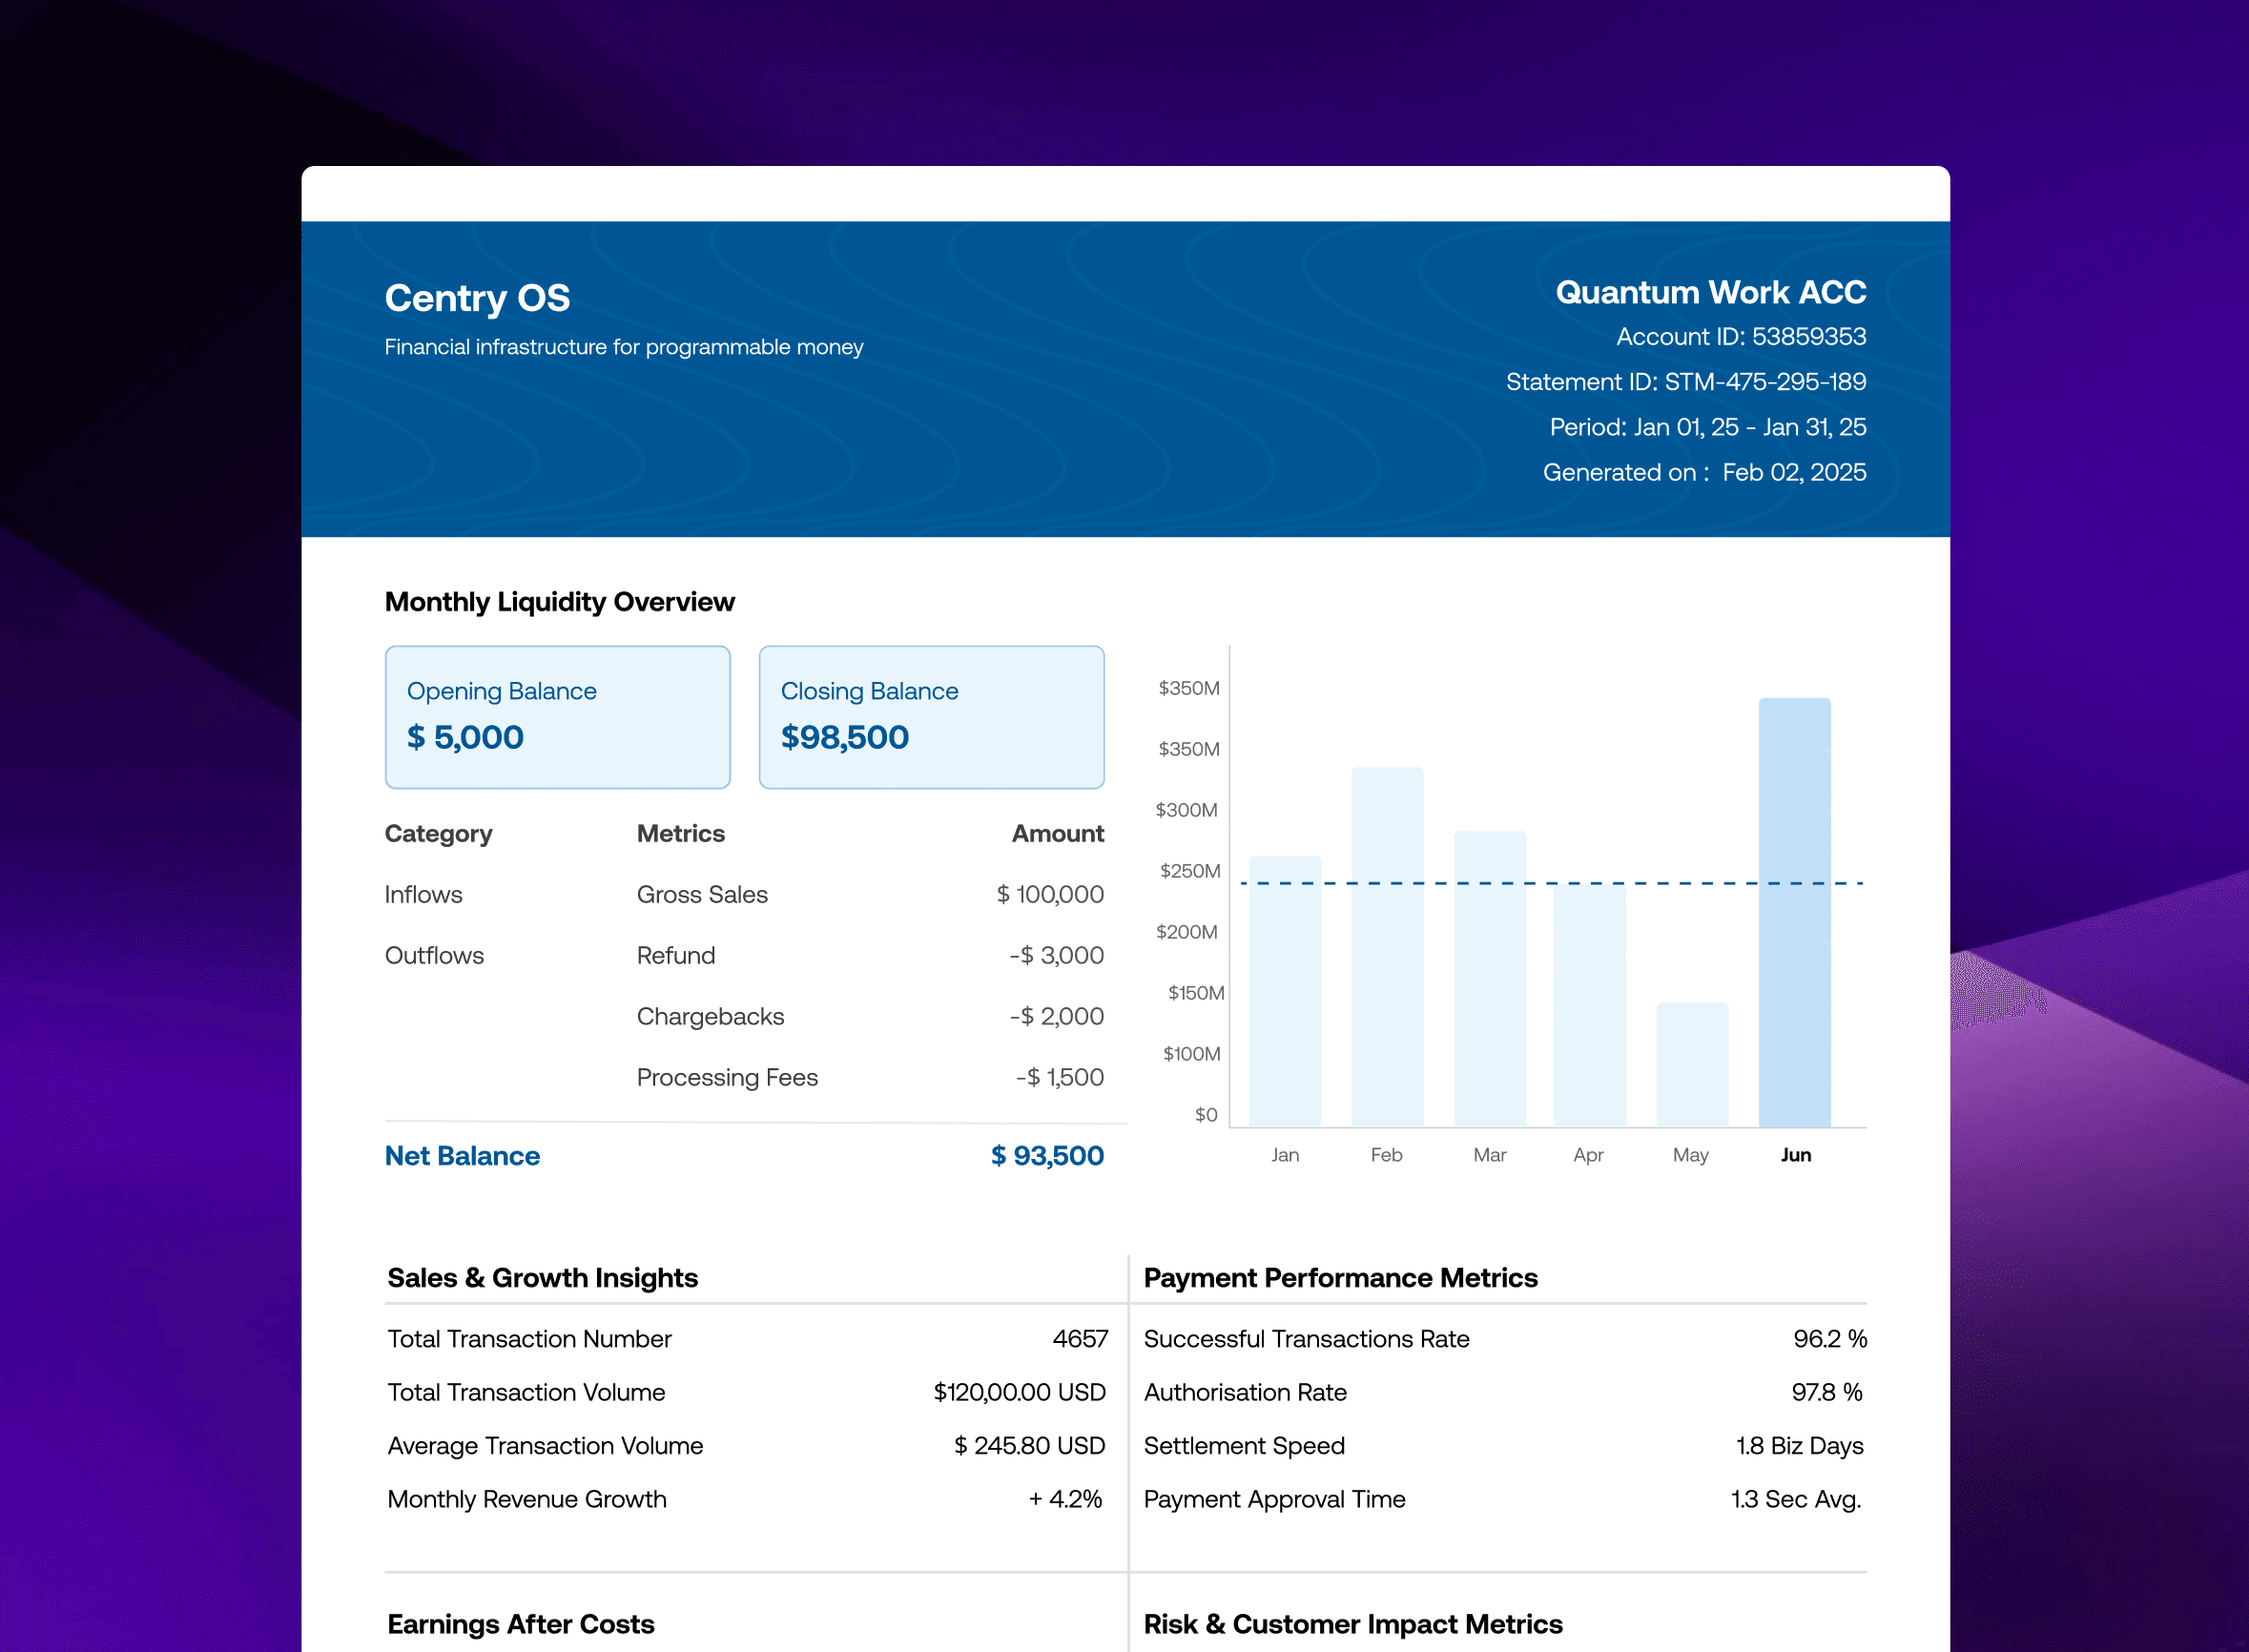
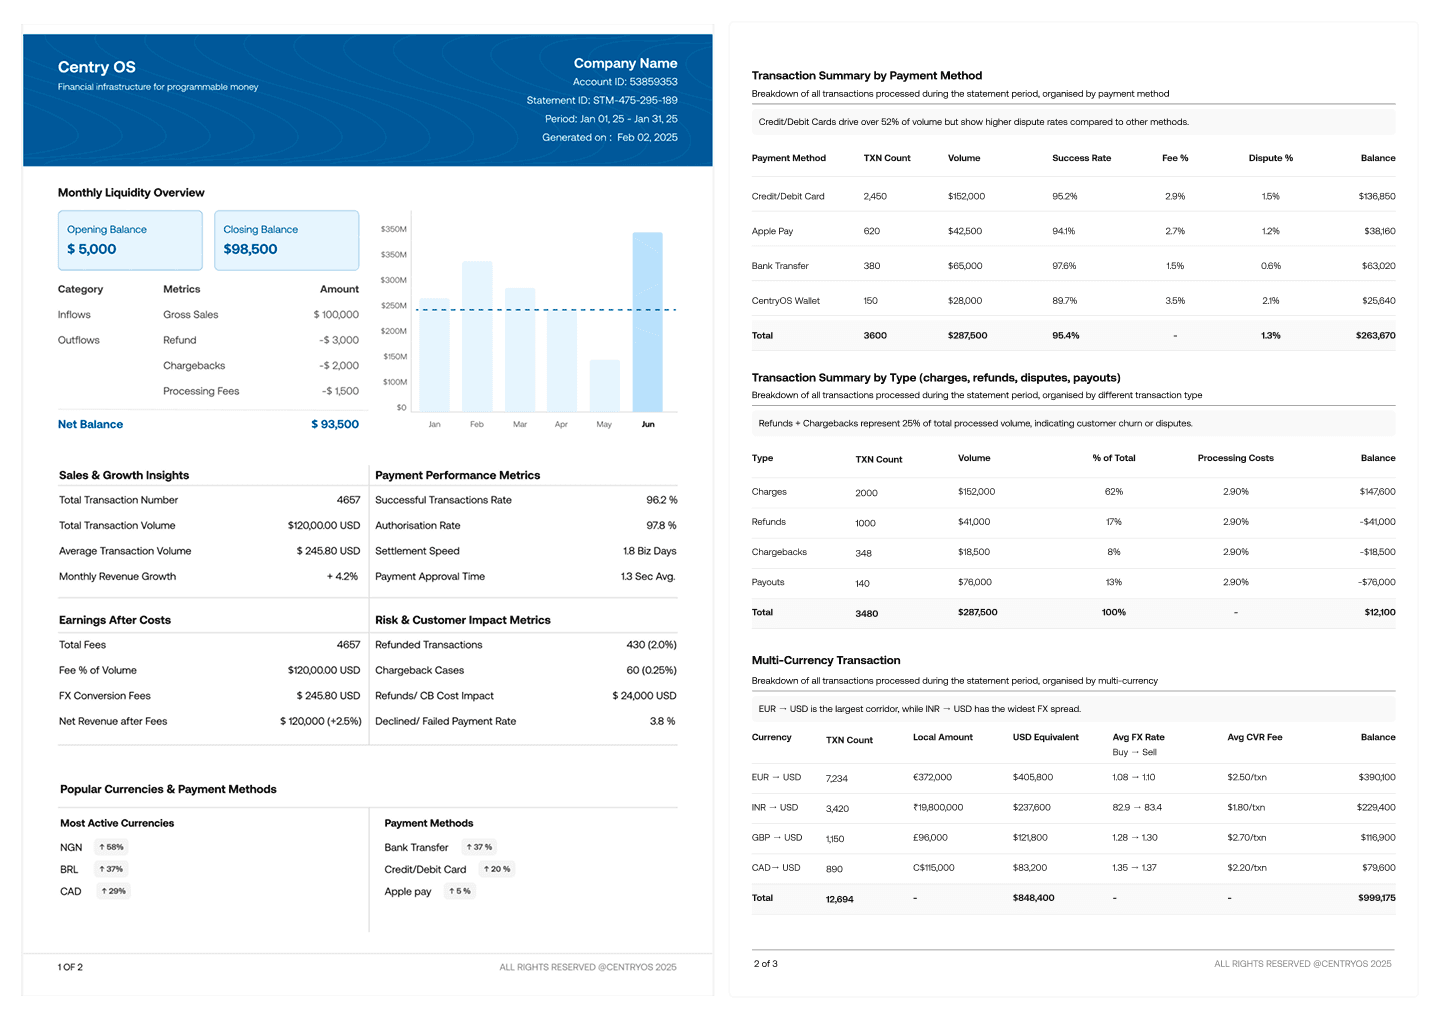
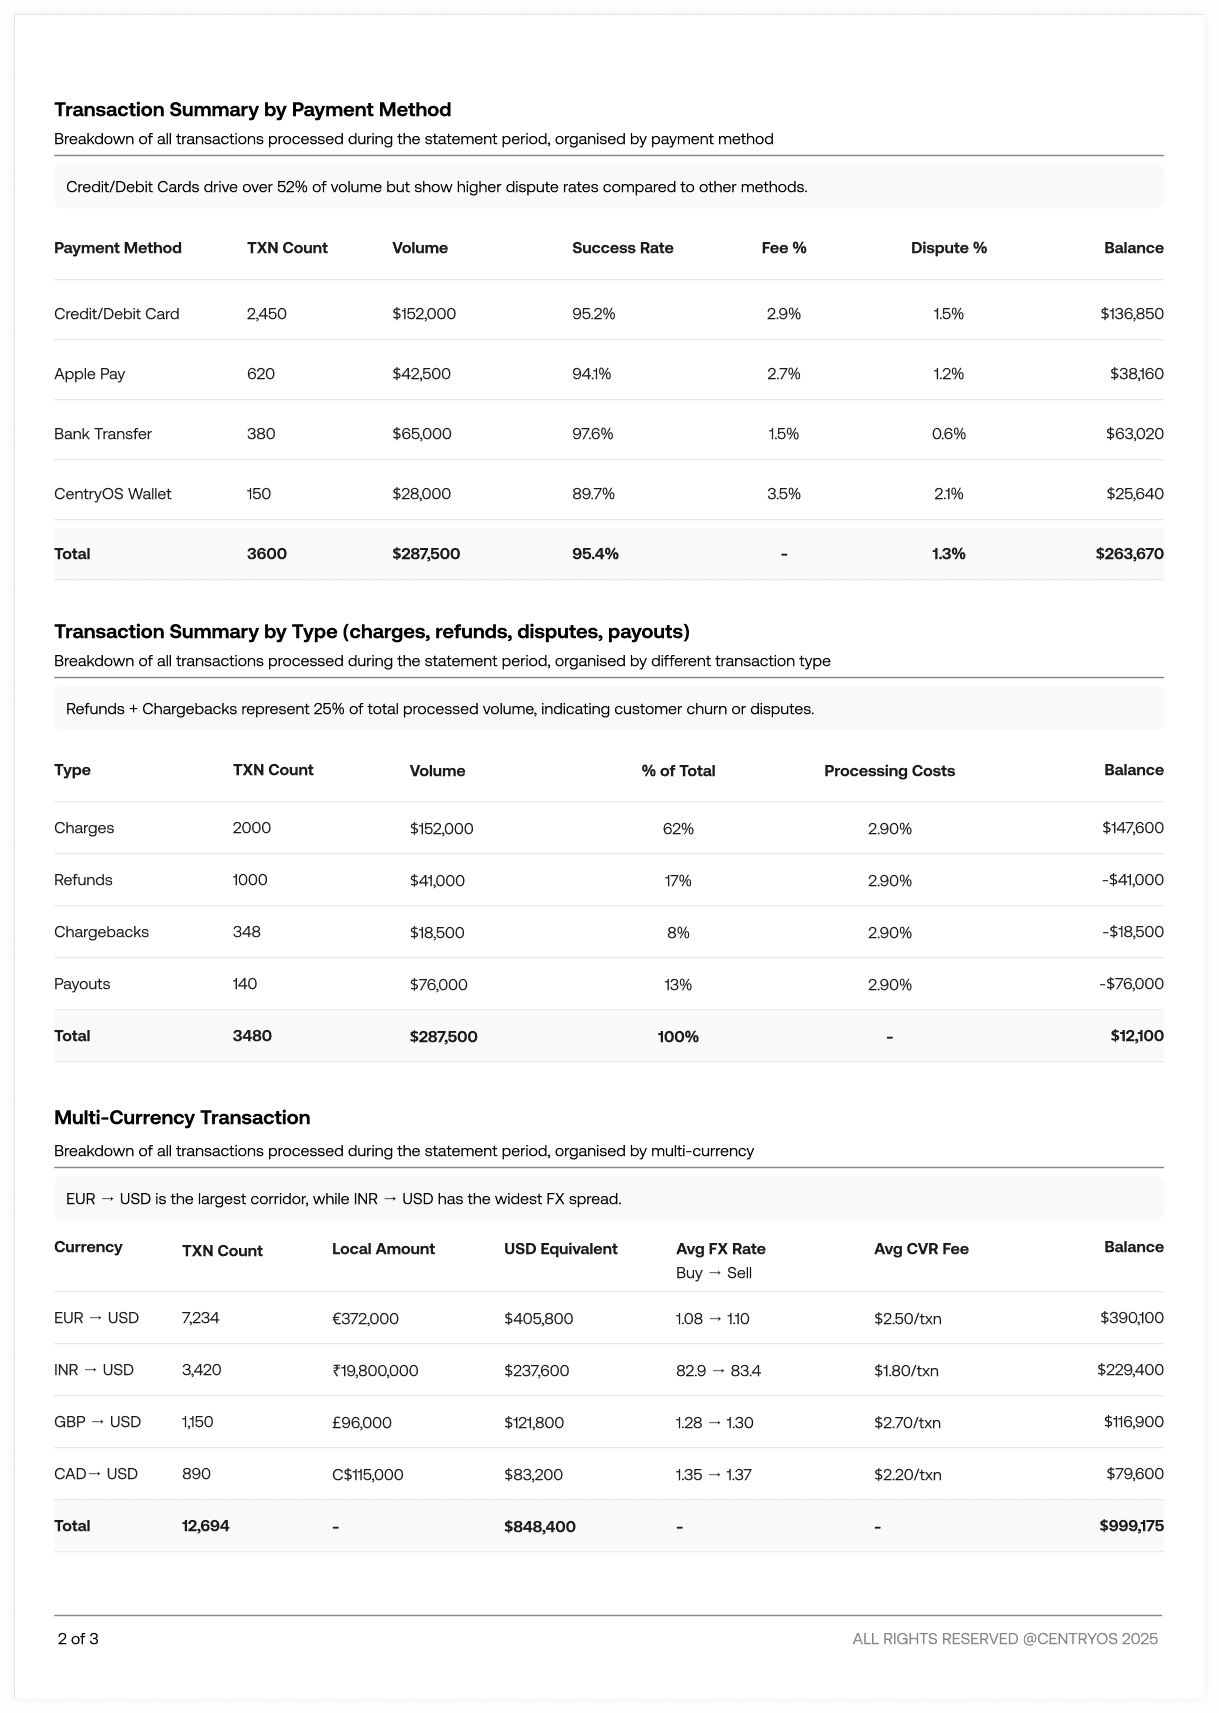
I redesigned the monthly merchant statement email so that it opens with what the business needs to know, not with what the system happened to record. The previous statement was a single page report that presented dense financial data with almost no structure. The redesign leads with a performance summary, visualizes payment trends, and groups transaction detail into sections that map to how merchants actually reconcile: settlements, fees, payouts, and currency movement.
Ownership
- I set the decision framework the team used. The design principles and the priority matrix were both my introduction, and both became shared tools rather than personal ones. The matrix in particular changed how the group made cuts, moving that conversation from seniority to criteria.
- I made the information architecture calls. Hierarchy, grouping, sectioning, what surfaces at the top of the statement, and how multi currency movement gets expressed.
- I explored and narrowed the design directions. Multiple layouts, tested hierarchy patterns, and iteration against feedback from both merchants and stakeholders.
- I worked directly with the developer throughout. Because the statement is generated programmatically rather than laid out by hand, what I could design was bounded by what the generator could produce from the transaction data. Keeping that a running conversation rather than a handoff is why the approved design shipped within the week instead of needing a second round of compromise.
Where I had influence beyond my own work
The research fundamentally changed the direction of the project. What began as a request to make the statement look better evolved into a clearer strategy: lead with the most important information and remove anything that did not justify its place. I introduced this reframing, and stakeholders adopted it, even agreeing to remove data they had initially considered essential.
Research and Strategy
Understanding and Analysing the current merchant experience
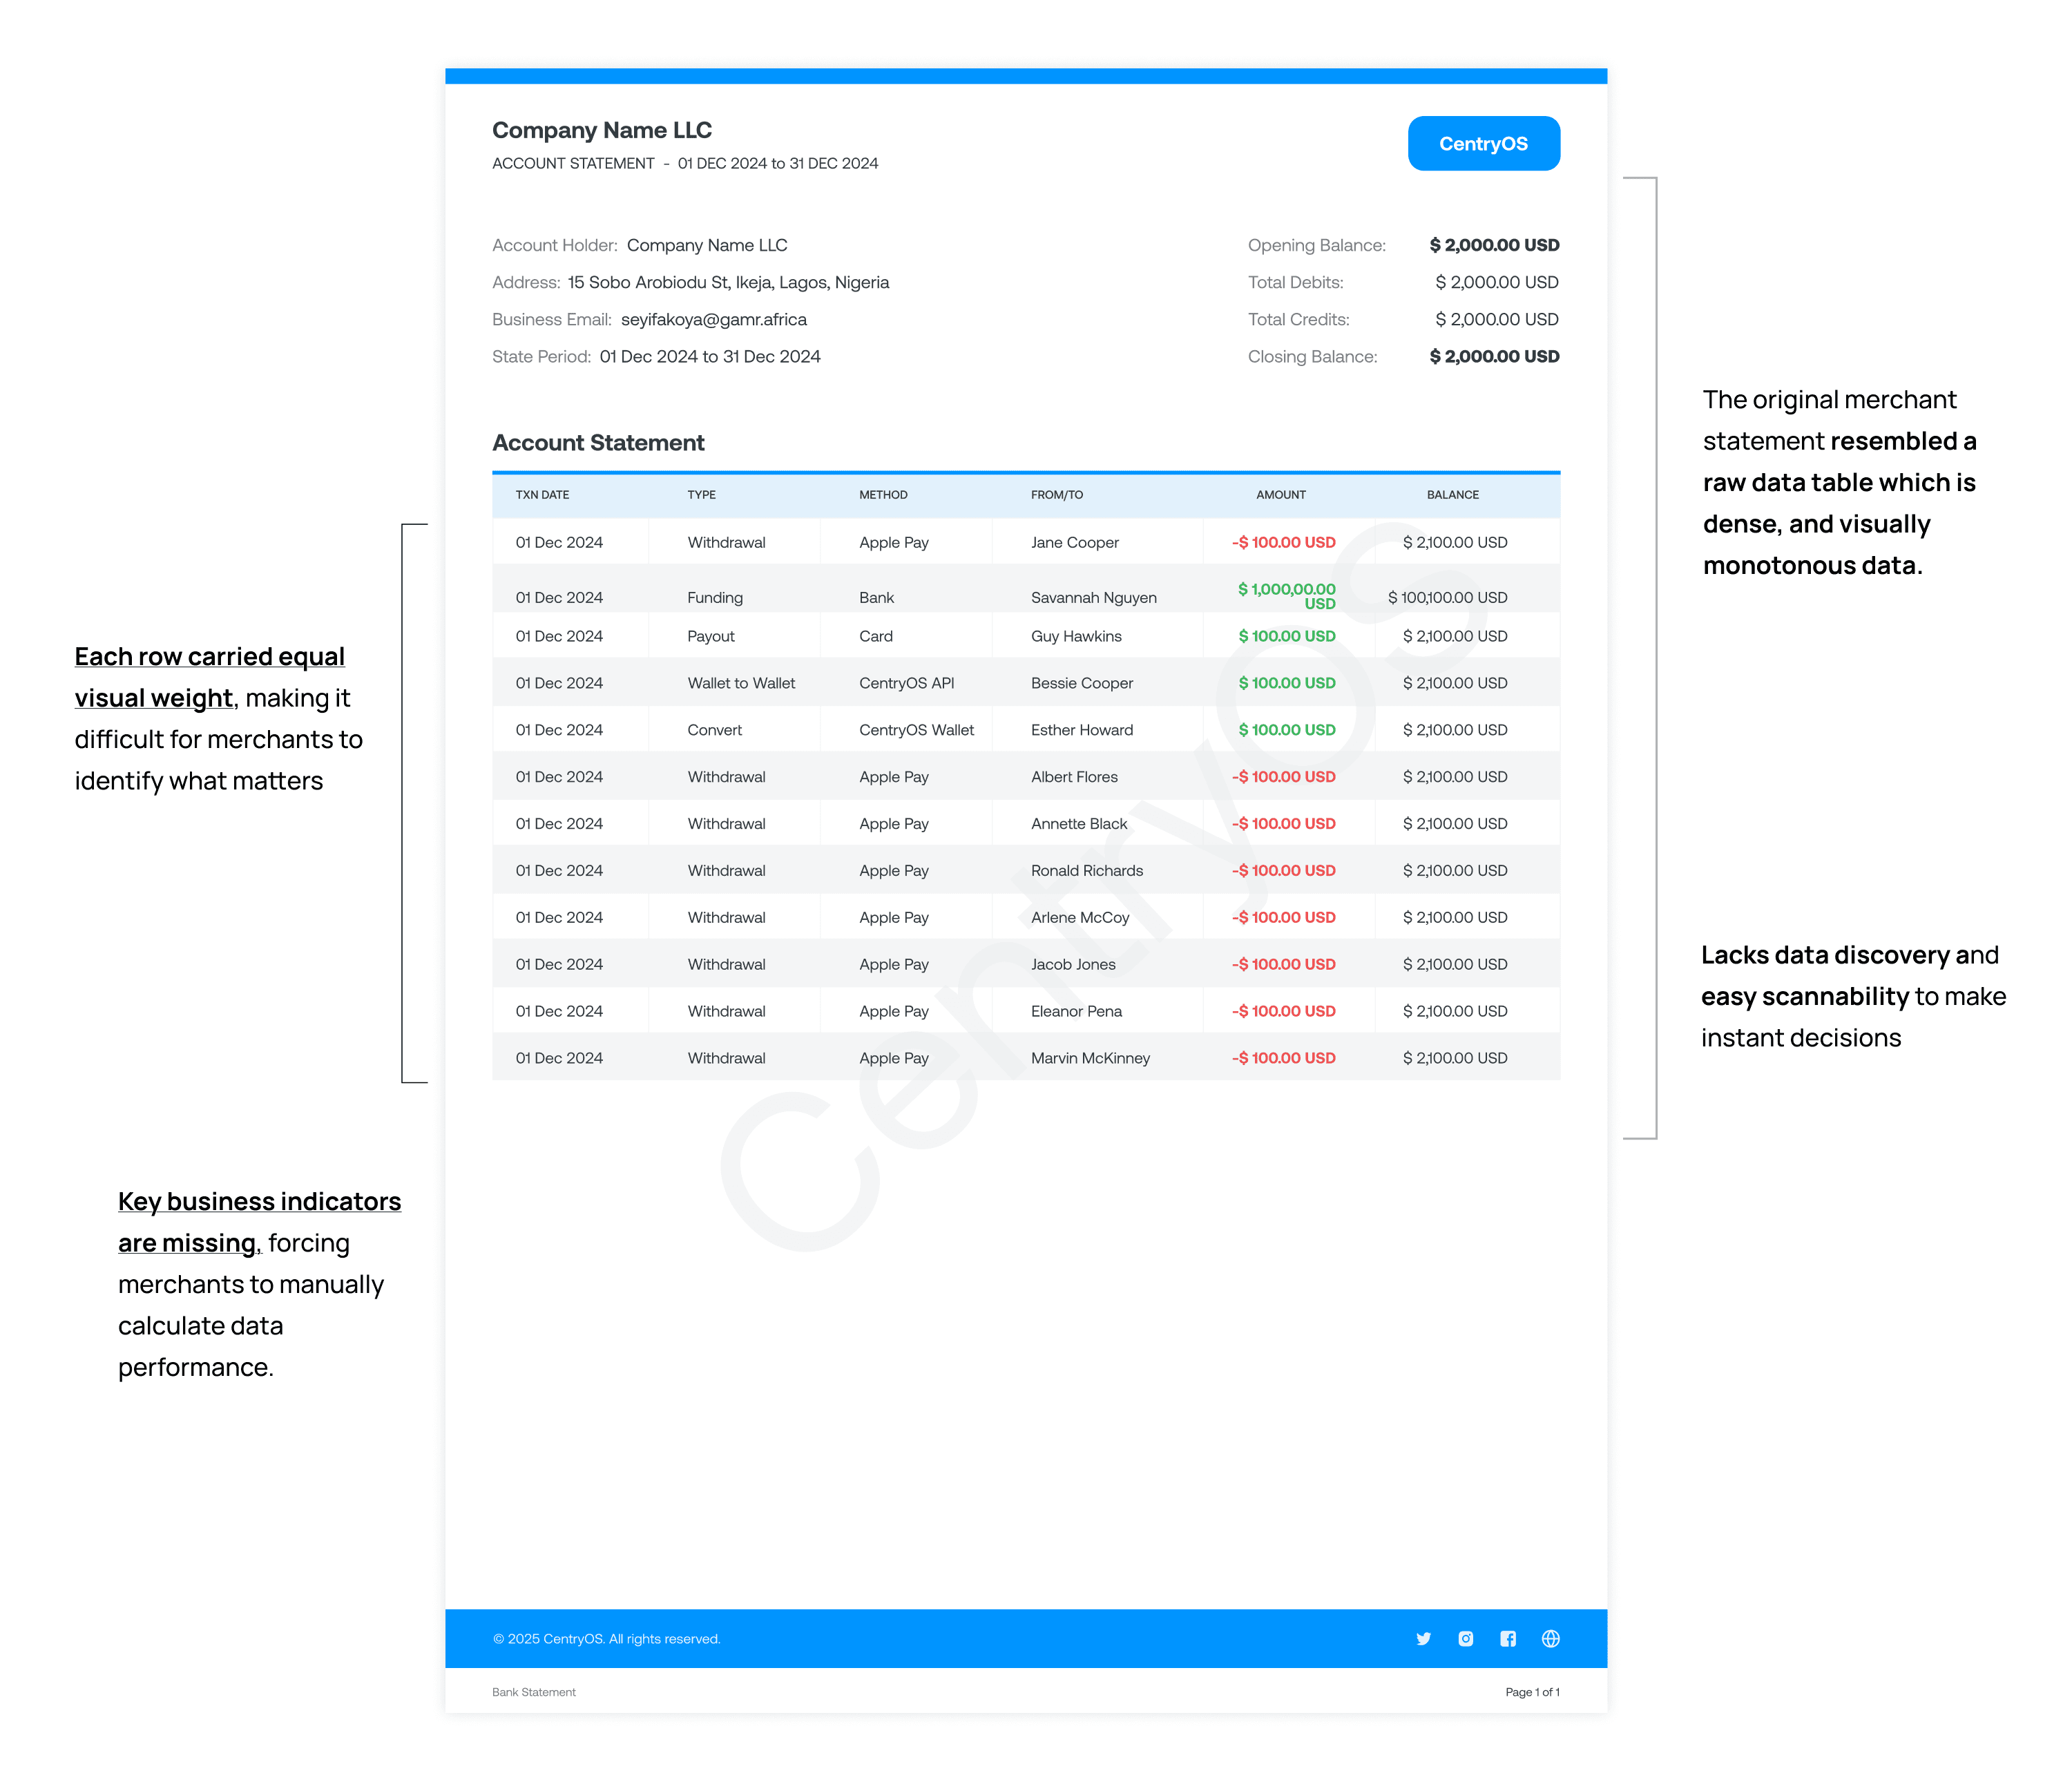
I started with a rapid UX audit of the existing statement email, a single page report with limited insight and little support for decision making. Alongside it, I ran usability testing sessions with 12 merchants, watching them navigate the statement and interpret the financial information. This showed where their reading actually broke down, not where I assumed it would.
Three findings came out consistently:
- Merchants struggled to identify which metrics mattered most.
- The financial data lacked hierarchy and felt overwhelming to scan.
- Merchants could not build an understanding of the transaction breakdown.
Research Questions
I translated the findings into three questions that guided every design decision that followed:
- Which financial metrics are genuinely relevant and valuable to merchants?
- How can the statement support faster and more confident business decisions?
- How can complex transaction data be structured so it feels clear and easy to navigate?
How I answered the three questions
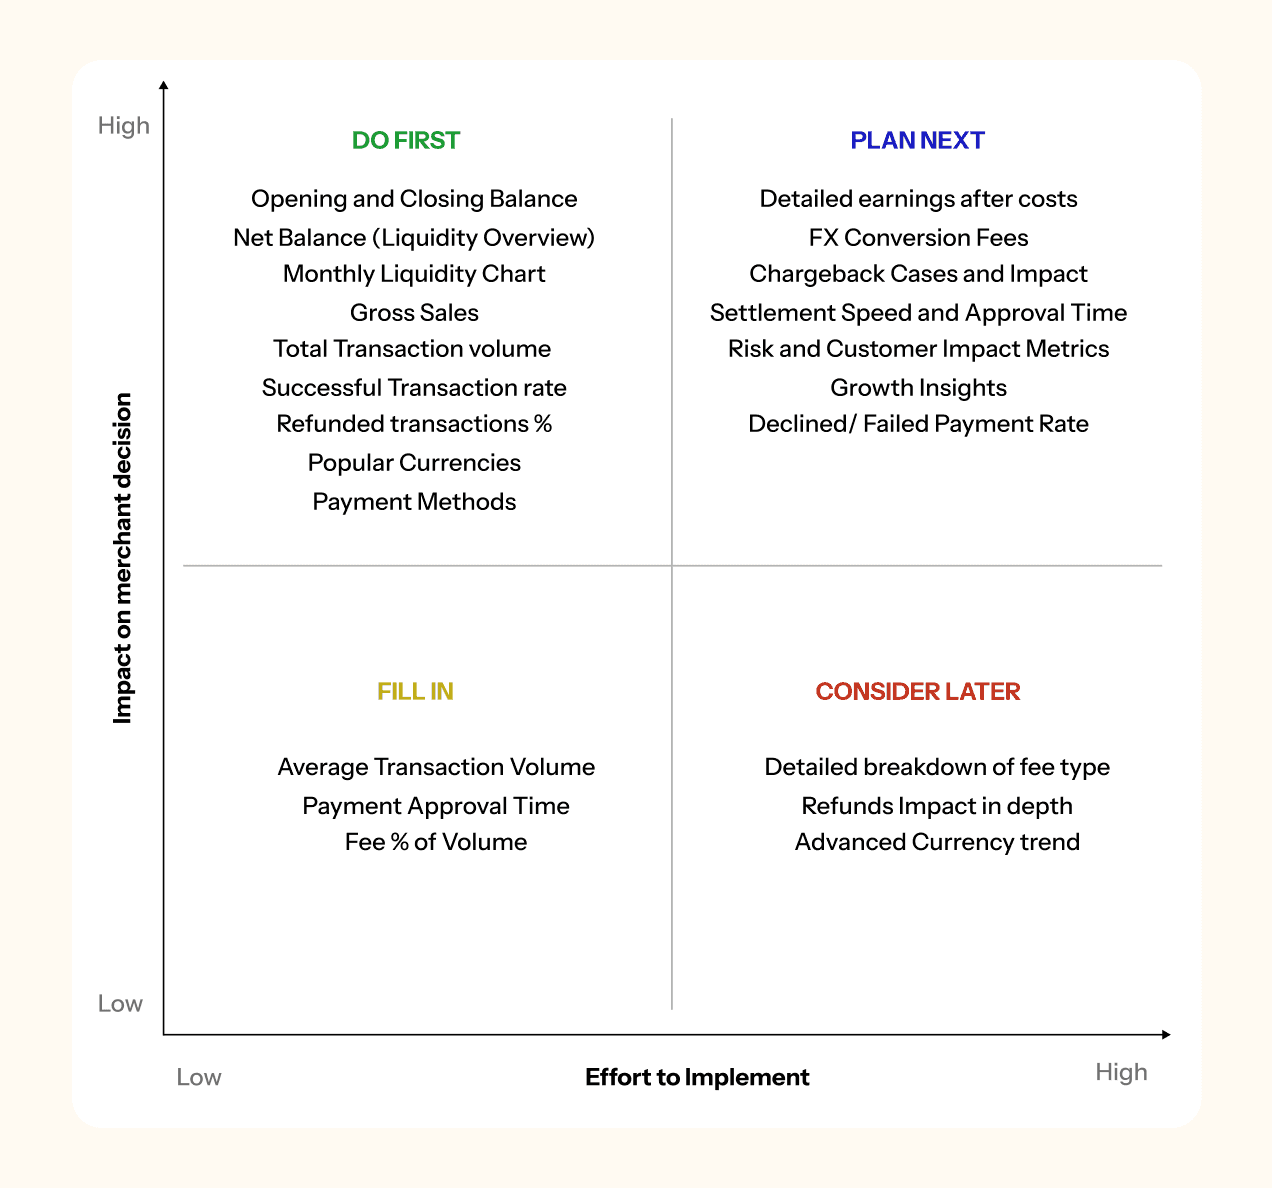
On which metrics matter, I ran a prioritisation exercise with stakeholders using a priority matrix, scoring each candidate data point on business value, merchant need, and frequency of use. This let me surface the information merchants actually use for reconciliation and performance tracking instead of defaulting to showing every available metric.
On supporting decisions, I explored ways to summarise key business insights upfront rather than requiring merchants to scan detailed tables and assemble the picture themselves.
On structuring the data, I tested different hierarchy patterns and layouts, evaluating each on how quickly it let someone navigate the statement and how much cognitive load it imposed while reading dense financial information.
Design Opportunity
The research narrowed the work to two clear opportunity spaces, which kept a one week project from sprawling:
- Visualizing financial trends and business performance: Merchants needed a faster way to understand how their business was performing without manually comparing numbers across multiple reports.
- Improving transaction breakdown visibility: Merchants wanted clearer visibility into settlements, fees, payouts, and currency movement so they could understand where money was coming from and where it was going.
Design principles as a decision framework
Before beginning the design process, I established a concise set of guiding principles. Given the one-week timeline, dense data, and involvement of multiple stakeholders, these principles helped set a clear direction, accelerate trade-off decisions, and ensure that each choice could be traced back to an established rule rather than personal preference. This made the final decisions more consistent and defensible during reviews.
01 Hierarchy of data
Order and grouping of data give more clarity than color ever will.
02 Be clear with currency movement
Be transparent about how currency data flows and how it affects the business.
03 Every number should have meaning
If it does not change behavior or explain a total, it is noise.
The third principle had the greatest impact. It gave me a clear framework for deciding what content to remove, one of the most challenging parts of designing a financial report, where nearly every metric has an internal stakeholder advocating for its inclusion.
Design
Building a flexible content system
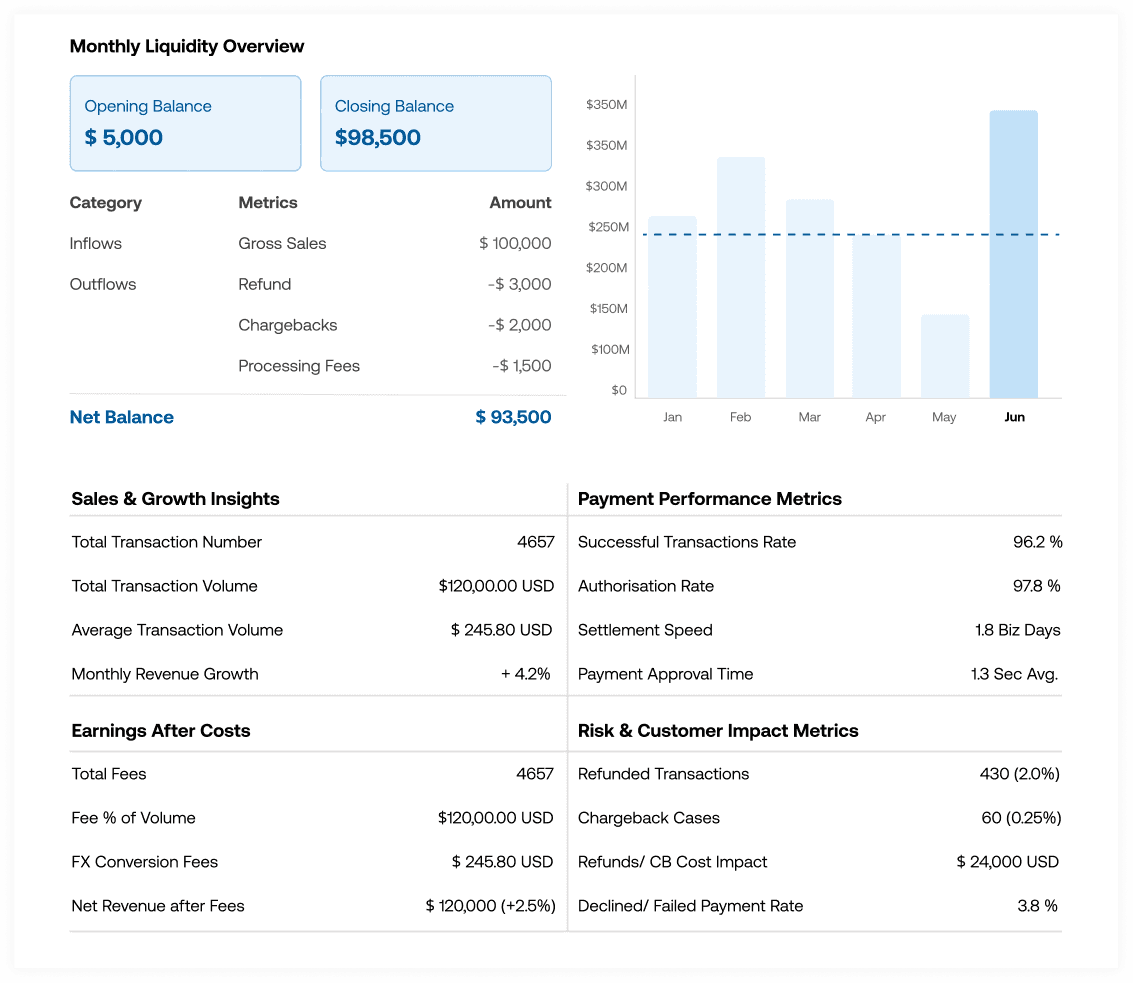
The final solution surfaced key metrics and summaries at the top of the statement, grouped related data to reduce cognitive load, and improved scannability through clear sections, spacing, and visual hierarchy. This enabled merchants to navigate complex transaction details more efficiently and make confident decisions directly from the statement.
Trade-offs I made across iterations
- Structure over color. In the original, red and green on the amount column were the only things distinguishing anything from anything else, which meant the document had the appearance of hierarchy without the function of it, and failed outright for color blind readers. I moved that work into grouping and spacing. The cost is a quieter looking document. The benefit is that the hierarchy actually survives contact with a reader.
- Giving the summary priority rather than inventing one. Opening balance, debits, credits, and closing balance were already on the original, set at the same visual weight as the mailing address. The work was not adding a summary, it was promoting it and making it mean something. That is a smaller intervention than it sounds and it moved more than anything else I did.
Design Decisions
Rather than reordering the existing table, I introduced a summary layer above it. The detail still exists for merchants who need to reconcile line by line, but the merchants who only need a health check no longer pay the cost of reading it. This came directly from the principle that every number should either change behavior or explain a total.
Structure over color. Color is the fastest way to appear to add hierarchy and the least reliable way to actually deliver it, especially in email where rendering varies and where color carries unintended meaning in financial contexts. I put the hierarchy into grouping and spacing instead.
Outcome
92% of merchants preferred the redesigned statement experience
The redesign shipped, and both merchants and company stakeholders gave positive feedback on how the summary emails helped them understand key business performance metrics.

Reflection
Designing for fintech turned out to be less about presenting data clearly and more about building trust through information.
The biggest learning was balancing business goals against usability. Through stakeholder discussion and usability testing I found that the most valuable insights are usually the simplest and most accessible ones. Small changes in grouping, spacing, and prioritization had a disproportionate effect on how quickly merchants understood their statements.
What I would do differently.
I would bring merchants in earlier and more consistently rather than concentrating validation in later iterations, which on a one week timeline meant I was confirming decisions more than shaping them. I would also explore personalized reporting for different merchant needs and business sizes, since a high volume merchant and a small one are reading for different things. Longer term, I would want to test an interactive statement rather than a static email, so merchants could explore the financial detail instead of only receiving it.